Project 01 - Research
Project 01 - Research
Overview
Traditional wound assessment is manual, subjective, and requires clinical expertise. This system uses microwave sensing combined with deep learning to classify wound severity automatically - healthy, mild, or severe - using non-invasive S-parameter measurements captured by a NanoVNA controlled via Raspberry Pi.
The Problem
Wound severity assessment is time-consuming and varies between clinicians. Remote or automated monitoring is impossible with traditional visual methods.
The Approach
Microwave signals interact differently with tissue depending on moisture and composition. S11 reflection parameters capture this behavior and feed a CNN trained on CWT scalogram images.
The Hardware
NanoVNA swept across microwave frequencies, Raspberry Pi 5 for automation and control, custom Python acquisition scripts, real-time data logging and preprocessing.
The Output
A real-time classification GUI that receives live S11 sweeps and outputs wound severity labels with confidence scores using a trained Keras CNN model.
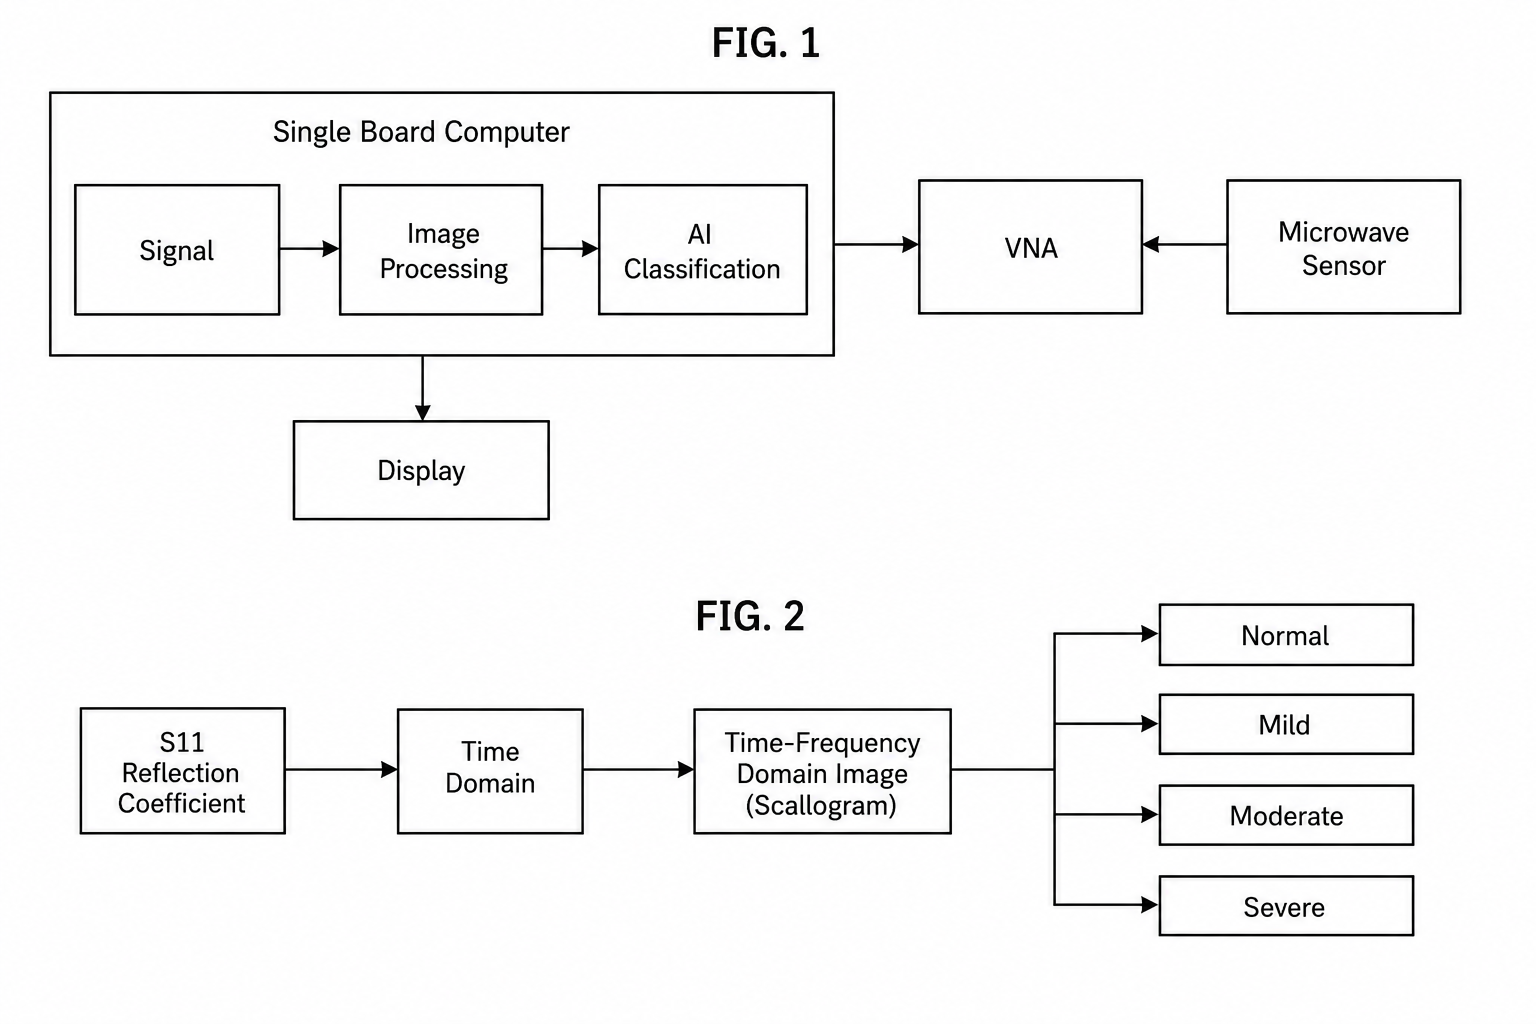
System Architecture
From physical microwave sweep to AI classification - a fully automated data flow designed for real-time operation.
Step 01
NanoVNA connected to Raspberry Pi via USB. Custom Python scripts automate frequency sweeps across the target range, capturing S11 magnitude and phase data into structured CSV files for each measurement session.
Step 02
Raw S11 sweep data undergoes signal preprocessing - normalization and noise filtering - then a Continuous Wavelet Transform (CWT) converts the 1D signal into a 2D time-frequency scalogram image (224x224, jet colormap). This becomes the CNN input.
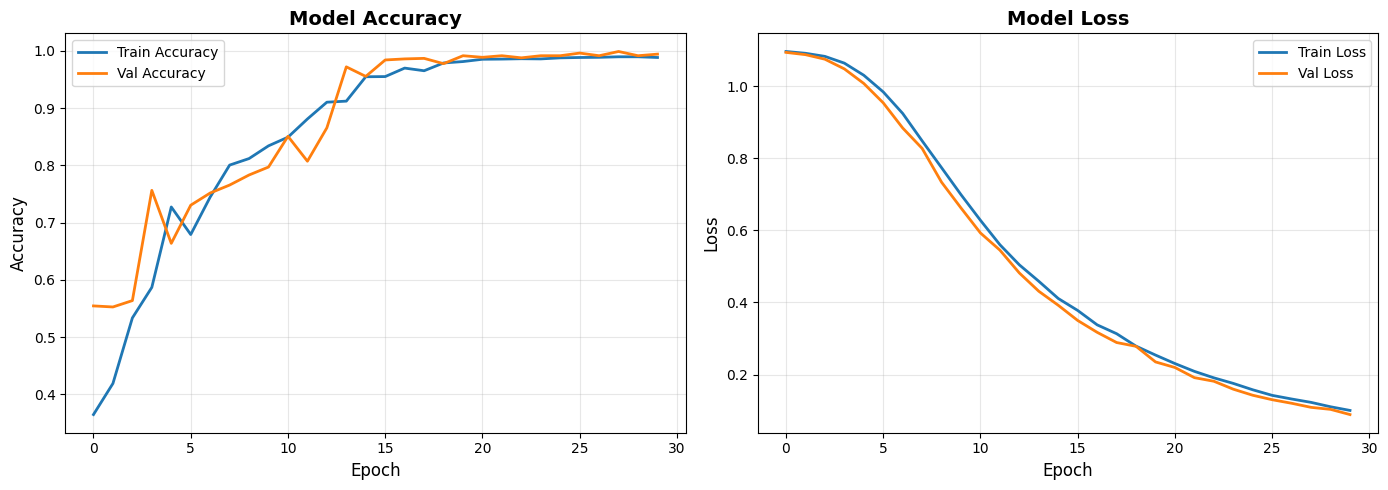
Step 03
A CNN trained on the scalogram image dataset using TensorFlow/Keras. The model learns to differentiate tissue conditions from microwave spectral signatures. Training conducted on Google Colab with augmentation for class balance.
Step 04
A PyQt5 desktop GUI application on Raspberry Pi loads the trained Keras model and performs live classification on incoming sweeps. Features dual Y-axis plotting, sweep navigation, batch classification, and tabular multi-sweep data display.
Documentation
Screenshots, hardware photos, scalogram examples, confusion matrices, and interface captures from the end-to-end wound monitoring workflow.
 System Architecture Diagram
 CWT Scalogram Visualization
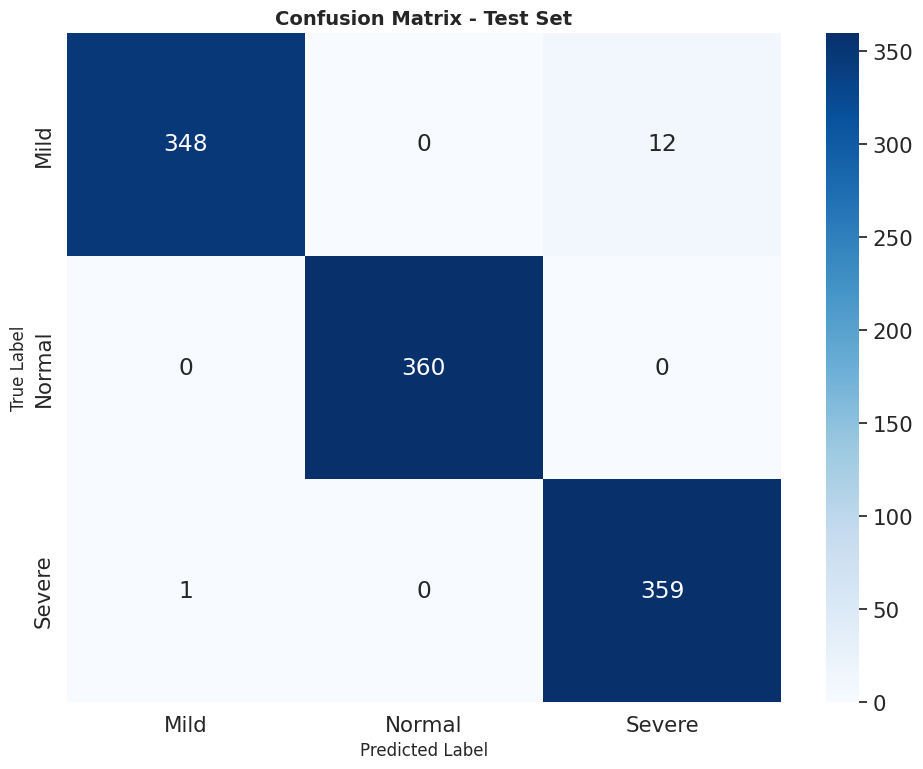 Confusion Matrix
 PyQt5 GUI Screenshot
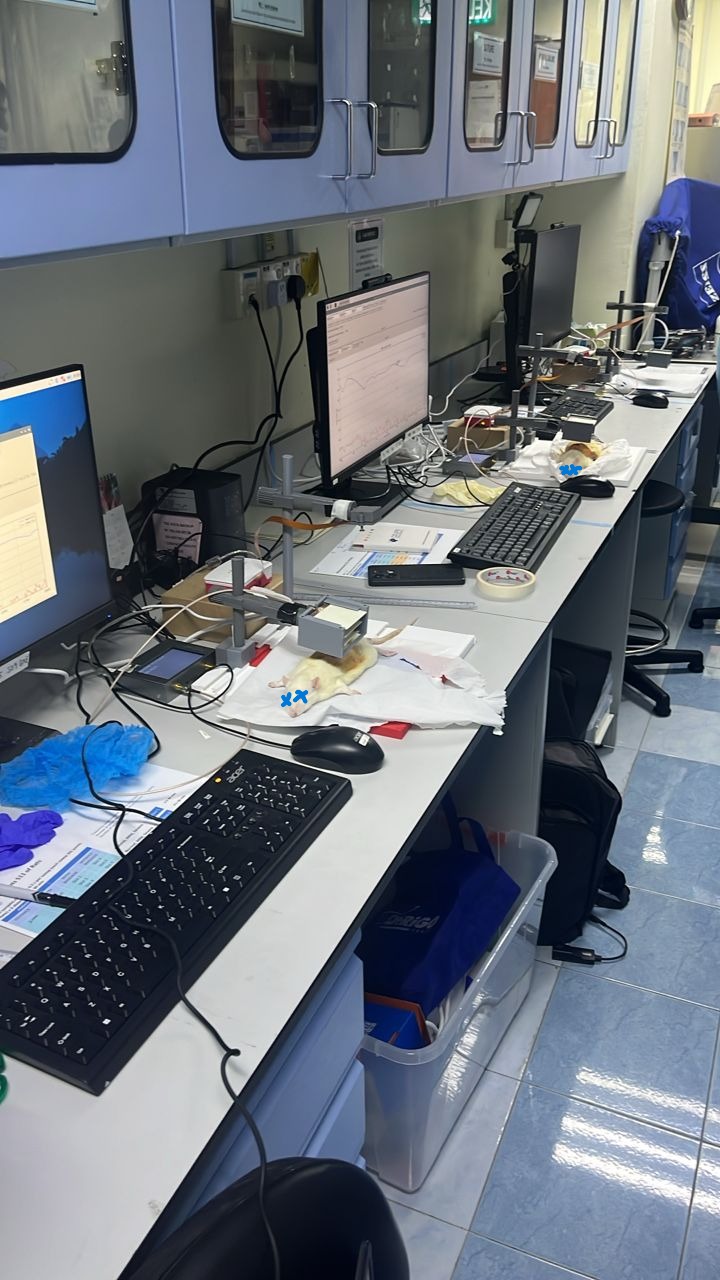
Collaboration
This project was in collaboration with DTERM from Universiti Kebangsaan Malaysia (UKM) for in lab rats specimen and wounds research
Deep Dive
Challenges Solved
pywt.cwt() to produce sharper and more informative scalogram images for deep learningKey Design Decisions
What I'd Add Next
Outcomes